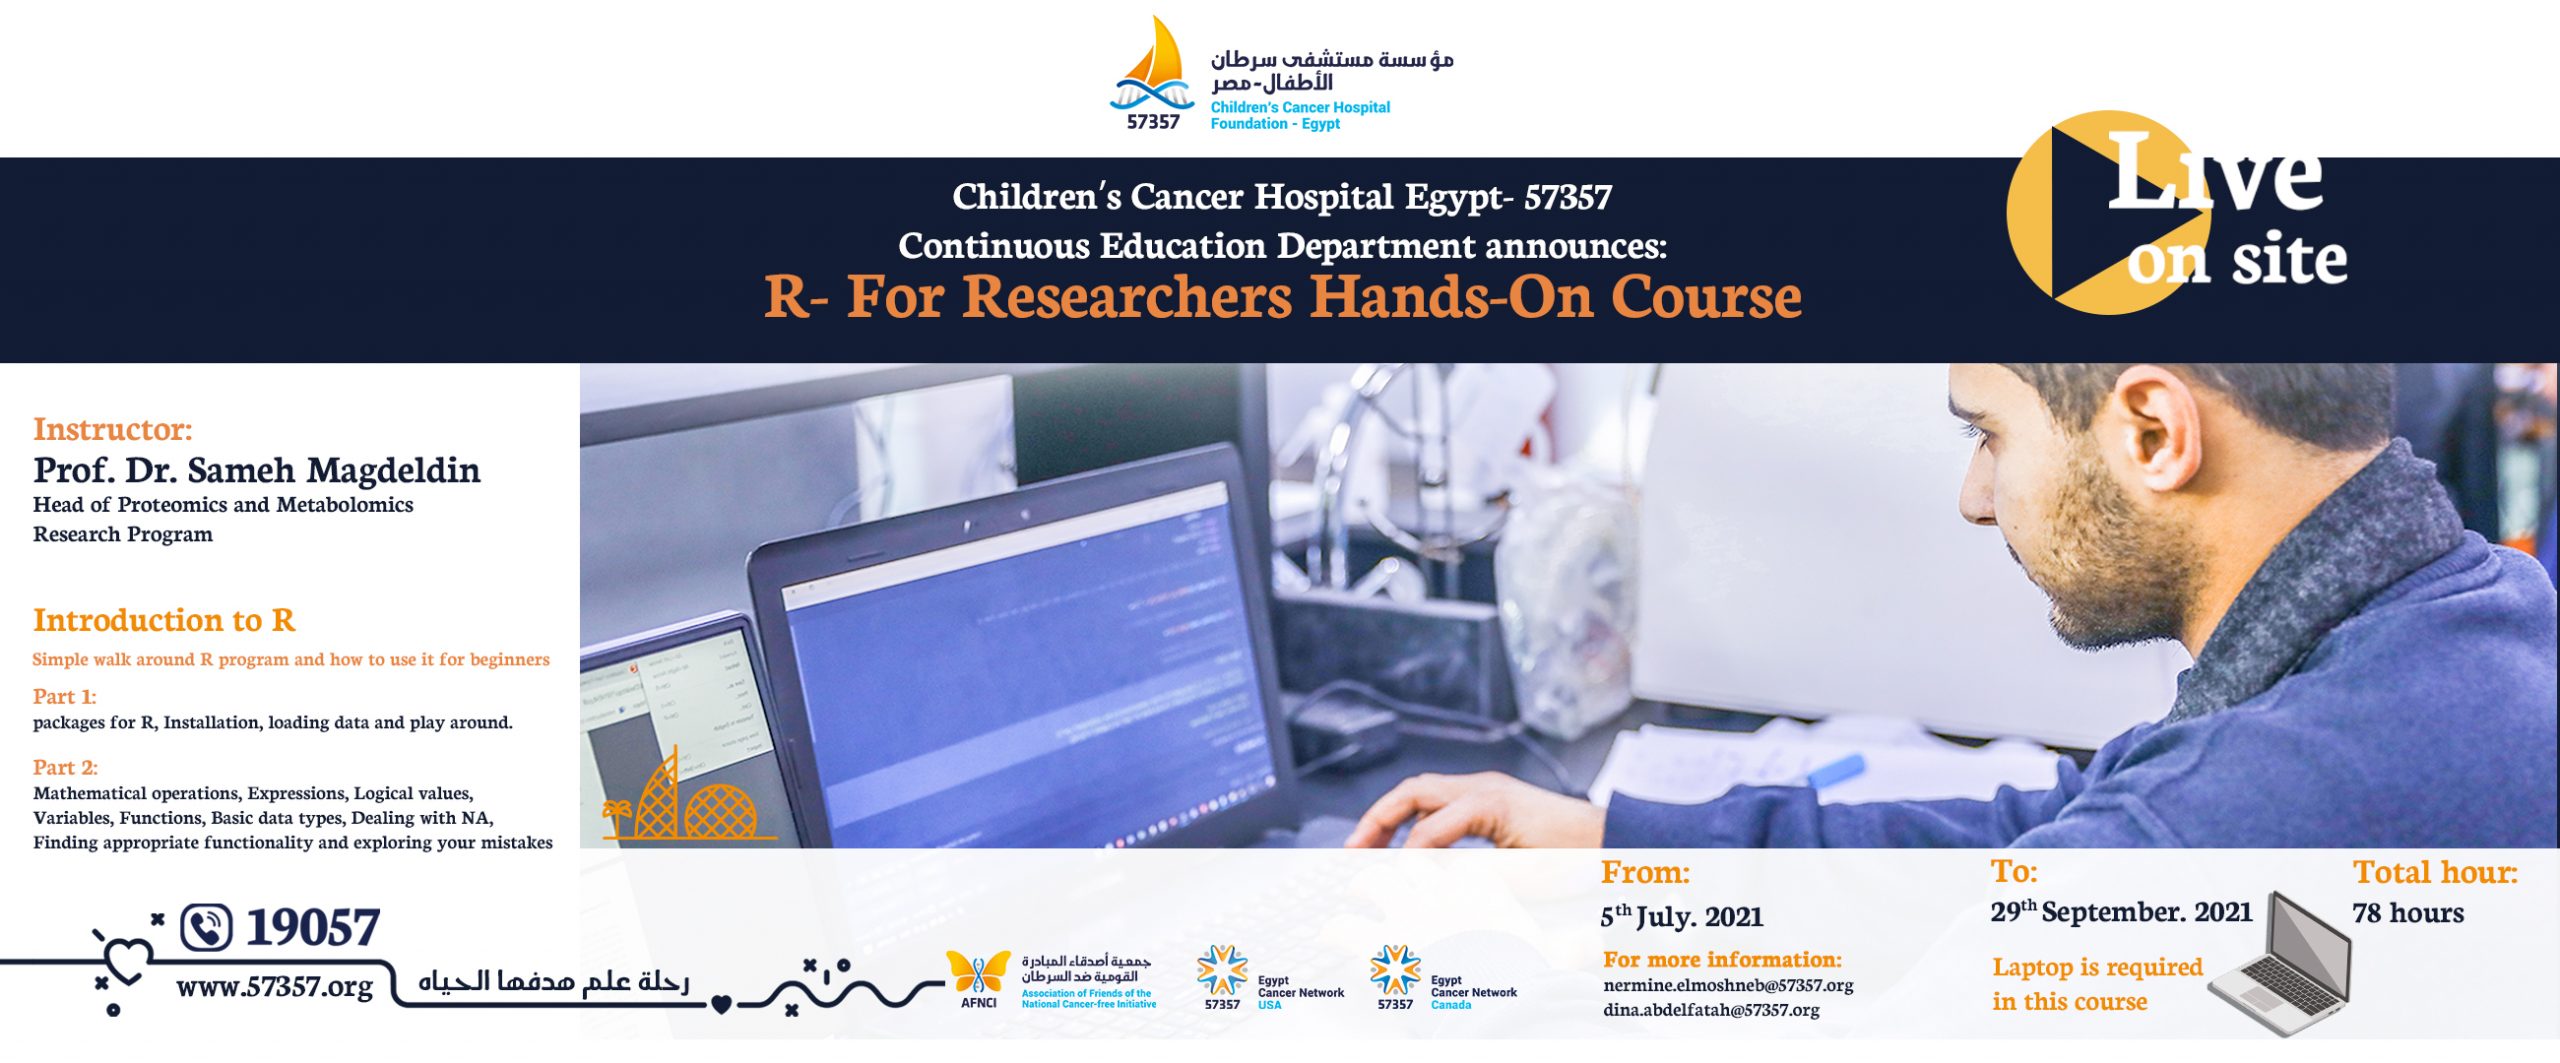
The course is mainly designed to allow researchers to be familiar with the R program, an open source- code based language, before using it in a professional way for your research purpose. The goal of this comprehensive course is to build researchers’ skills in data manipulation, biostatistical interpretation and graphical representation of data. Acquiring such skills is crucial in an era of competitive international publication.
Upon completion of this course, participants will be able to:
- Refine your data before analyzing it, choose you appropriate test and interpret the data in a professional manner.
- Learn how to draw the basic graphics for your research using the base built in graphics package in R.
- Understand how to correlate variables and fit a regression model for your data in a professional manner.
- Deal with large data input in a professional way. Unlike spreadsheet (excel) avoid errors and save time by using automated coding.
- Draw professional graphics for international publications.
- Understand how to perform logistic regression and predict binomial (binary) variable.
- Demonstrate knowledge on how to perform, read and draw a PCA.
- Understand how to perform and read a ROC curve. Choosing a cut point between poor observations and good ones.
